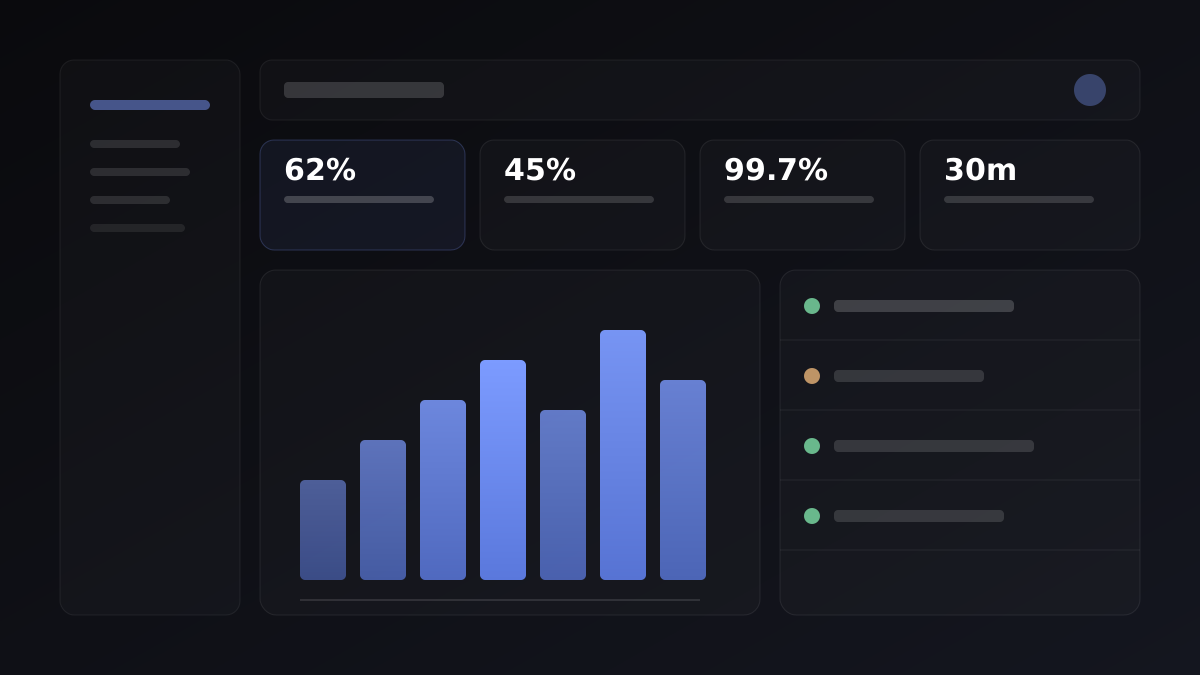
We have data, but no insights.
We build dashboards that surface the metrics you actually need to make decisions, filtering out the noise.
We build automated pipelines, centralized data warehouses, and fast, intuitive dashboards that give you a single source of truth—so you can stop guessing and start growing.
Sound Familiar?
If you're spending more time wrangling spreadsheets than analyzing the results, it's time to upgrade your data infrastructure.
We build dashboards that surface the metrics you actually need to make decisions, filtering out the noise.
Automated pipelines that aggregate data from multiple sources in real-time, eliminating spreadsheet wrangling.
A single source of truth data warehouse that unifies your metrics across marketing, sales, and product.
Deep analytics that uncover trends, anomalies, and root causes so you can proactively adjust strategy.
Data cleaning and transformation pipelines that ensure data integrity before it reaches your reports.
Comprehensive event tracking plans tailored to your product, capturing user behavior accurately.
Trusted by 40+ companies













What's Included
Not an upsell list — this is the baseline on every data analytics project we take, whatever the size.
We work with stakeholders to define the exact KPIs that matter and trace them back to raw data sources.
Planning the optimal data stack—from extraction tools to warehouse schema—to balance cost and performance.
Building robust, automated processes to clean, transform, and aggregate data from APIs and databases.
Designing and developing intuitive visual interfaces that make complex data instantly understandable.
Rigorous QA to ensure the numbers on the dashboard exactly match the reality of your business.
Monitoring pipeline health and updating metrics as your business goals evolve.
We work with stakeholders to define the exact KPIs that matter and trace them back to raw data sources.
Who It's For
The data stack changes depending on your business model, scale, and what decisions you're trying to drive.
Sales funnels, cart abandonment analysis, and inventory forecasting to maximize revenue and minimize stockouts.
Churn prediction, user engagement tracking, and MRR dashboards to understand and improve customer lifetime value.
Patient outcomes tracking, resource utilization analysis, and compliance reporting built with strict data privacy.
Risk analysis models, fraud detection algorithms, and portfolio performance dashboards for rapid decision making.
Campaign ROI measurement, attribution modeling, and customer segmentation to optimize ad spend across channels.
Supply chain optimization, bottleneck identification, and operational efficiency metrics to streamline your business.
Scope Estimator
Pick what you need and we'll show an honest range. It's an estimate, not a quote — but it's the same maths we start from.
Six stages from first call to a live dashboard — nothing advances until the stage before it is signed off.
Quality Bar
Every build is measured against these before it's allowed to ship — not aspirations, gates.
The Data Stack
Chosen per project, not by habit — the right tool for your data, your team, and what you'll need to maintain.
 Python
 AWS
 PostgreSQL
 Docker
 MongoDB
 React
Related Work
Client Voices
They didn't just build dashboards; they gave us clarity. For the first time, our leadership team trusts the numbers.
We were able to successfully complete the project by meeting the best partner. They have a very good understanding of development and skills, and are fully committed to the task schedule.
Their communication and problem-solving skills are top-notch. The entire workflow was smooth and professional.
Amazing team! Delivered everything on time with exceptional quality. Totally recommend!
Honestly, we were struggling to keep up with our growth until they stepped in. They didn't just build the tech; they actually understood our users. It's been a total game-changer for our workflow, and the design is just spot on.
What I love most is that they don't just say 'yes' to everything — they tell us what's actually going to work. The whole process felt super collaborative, and they genuinely cared about making the project a success.
Our Principles
We build rigorous validation into our pipelines. If a dashboard shows a number, you can bet your business on it.
AccurateWe design tools for business users, not just analysts. Everyone who needs insights should be able to get them.
AccessibleWe don't build charts just to look pretty. Every metric we surface is tied to a specific business decision.
ActionablePowerful data warehousing, ELT pipelines, and visualization tools to turn raw data into actionable business intelligence.
What You Receive
Here is the exact list of what lands in your accounts when the project closes.
Custom-built, fast-loading dashboards tailored to your specific KPIs, accessible to stakeholders without technical skills.
A scalable, centralized repository for all your business data, optimized for complex queries and reporting.
Robust data extraction, transformation, and loading processes that run silently in the background.
Comprehensive documentation defining every metric, data source, and transformation rule for your team.
Detailed specifications for developers on what events to track, when to fire them, and what properties to include.
Workshops and documentation ensuring your team knows how to use the dashboards and read the metrics.
Why Us
Off-the-shelf BI, an internal hire, and a generic agency all solve part of the problem. Here's where each one tends to leave you exposed.
FAQ
Don't see yours here? Ask us directly →
Almost anything. We regularly integrate with CRMs (Salesforce, HubSpot), ERPs, marketing platforms (Google Ads, Meta), payment gateways (Stripe), and custom internal databases (SQL, NoSQL).
Not necessarily. We can build custom dashboards using React and modern charting libraries, or implement cost-effective open-source solutions like Metabase or Superset if that fits your needs better.
Security is foundational. We use encrypted connections, role-based access control, and comply with standards like GDPR and HIPAA. Your data remains in your control.
Yes. We start with a data audit to trace the discrepancies back to the source. Usually, the issue isn't the dashboard tool, but the underlying data pipeline and modeling.
While a full data warehouse takes time, we prioritize 'quick wins'. We can often connect 1-2 critical sources and deliver an initial high-value dashboard within 2-3 weeks.
Yes, but we ensure your foundational data is solid first. Once you have reliable historical data, we can build models for forecasting, churn prediction, or recommendation engines.
What Happens Next
No drawn-out sales process. Reach out and here's exactly what follows.
We discuss your current data setup, the questions you can't answer, and the bottlenecks in your reporting.
We map out your data sources and provide a clear architectural plan and fixed-price quote.
We start building pipelines and wireframing dashboards, keeping you involved in the metric definitions.
Explore More
Modern websites and web applications tailored to your business needs.
→Mobile apps, SaaS platforms, and cloud-native solutions built from scratch.
→UX research, wireframes, prototypes, design systems, and accessibility.
→Custom stores, B2B commerce platforms, marketplaces, and payment integrations.
→ERP, CRM, workflow automation, legacy modernization, and integrations.
→AI agents, chatbots, generative AI, and workflow automation that works.
→Ongoing maintenance, technical support, and dedicated team augmentation.
→Start Here
A structured conversation about your data — your sources, your reporting gaps, your constraints. We scope what should be built first, what can wait, and what it takes to ship it.